Update on Interpretation of Spirometry.
By Dr James Douglas, Thoracic and Sleep Physician, North Brisbane Sleep & Thoracic
In 2022, the European Respiratory Journal published the 2021 European Respiratory Society/American Thoracic Society Technical Standard on Interpretive Strategies for Routine Lung Function Tests. This is the first update on this topic since 2005.
There are several important general differences in these updated recommendations. The updated recommendations stress that–
-
there is more emphasis on using lung function testing to classify physiology, rather than to make a clinical diagnosis,
-
there is more emphasis on uncertainty of interpretation, especially near the lower limit of normal
-
to use Global Lung Function Initiative (GLI) reference equations for spirometry (and for that matter lung volumes and gas transfer),
-
there is incomplete understanding of the role of race/ethnicity on lung function and
-
biological sex, not gender be used to interpret lung function
Defining the normal range, the new guidelines emphasise the following:
-
To generally use the lower limit of normal as the 5th percentile and the upper limit of normal is the 95th percentile. See below for further explanation. The use of the 80% predicted value to define normal is strongly discouraged
-
The use of a fixed ratio to define obstruction e.g. FEV1/FVC < 0.7 /70% is not recommended. This remains an area of contention, as COPDX Guidelines still include as part of their definition, a postbronchodilator FEV1/FVC ratio < 0.7.
Bronchodilator response:
-
The new guidelines suggest an alternative approach. However there has been no change in the National Asthma Handbook or COPDX Guidelines. Consequently NBST's approach is to continue to use the existing guidelines:
-
Method: 4 puffs of Salbutamol 100 mcg /puff and repeat spirometry 15 minutes later
-
-
A significant bronchodilator response is defined as a ≥ 12% AND 200 mL increase in FEV1 or FVC post bronchodilator.
Severity of Lung Function Impairment:
-
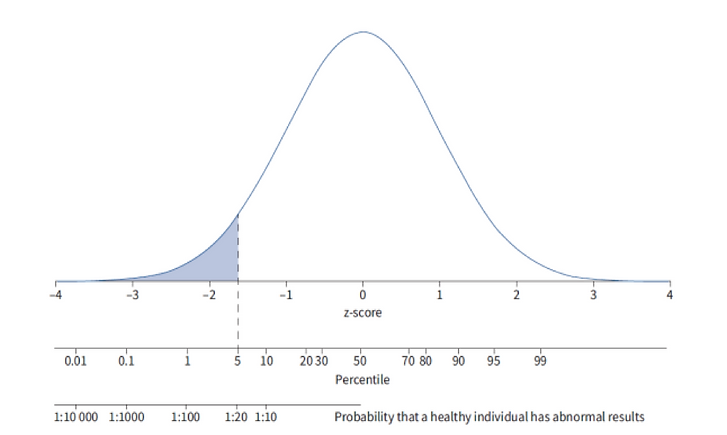
The new guidelines recommend for all measures to use the z-score. A z-score is the number of standard deviations away from the mean. Z-scores can also be described in terms of percentiles. Population-defined z-scores or percentile values, describe the chance of an observed result falling within the distribution of healthy individuals. A reference range represents the distribution of values that are expected in a healthy population, and the lower limit of normal (LLN) represents a cut off to define results that are outside the range of values typically observed in health. At the 5th percentile (which corresponds to a Z-score of -1.645), there is a 5% chance that the results in a healthy individual would be at or below this level. At the 1st percentile, there would be a 1% chance.
-
The figure below demonstrates Z scores, percentiles and the probability of a healthy individual being this classified using these values.

-
For all measures of lung impairment, use z-scores:
-
Mild impairment: z-score between -1.65 to -2.5
-
Moderate impairment: z-score value between -2.51 to -4
-
Severe impairment: z score < -4.1
-
